The majority of medical cannabis patients prefer to smoke their cannabis. This is probably because smoking cannabis is relatively fast in onset and easy to dose.
Example by numbers: smoking a joint
Now let’s breakdown what happens when you smoke a cannabis cigarette (adapted from (McGilveray, 2005)).
A cigarette containing 35 mg THC produces peak THC levels of 162 ng/ml plasma 10 minutes after onset of smoking.
An average human has approximately 5l of blood meaning that 162 x 5000 = 810 μg of THC is bioavailable at peak levels, corresponding to bioavailability of 0.81/35 = 2.4% at peak levels.
Peak THC levels are 162 ng/ml. The molecular weight of THC is 314g/mol. 314 ng of THC in 1 ml of plasma corresponds to a 1 μM THC concentration. Therefore, our measured concentration of 162 ng/ml corresponds to 520 nM THC at peak. After 30 minutes, ~20% or ~100 nM is still bioavailable. After 2 hours, ~3% or 15 nM of THC is still bioavailable.
With relative affinities for THC of 10 nM and 24 nM for CB1 and CB2 receptors it can be assumed that most biological activity of THC will have disappeared within 2 hours after smoking a cannabis cigarette (An affinity of 10 nM means that at this concentration 50% of receptors are bound/activated by THC).
Now let’s see what happens in the body when someone smokes cannabis (Figure below).
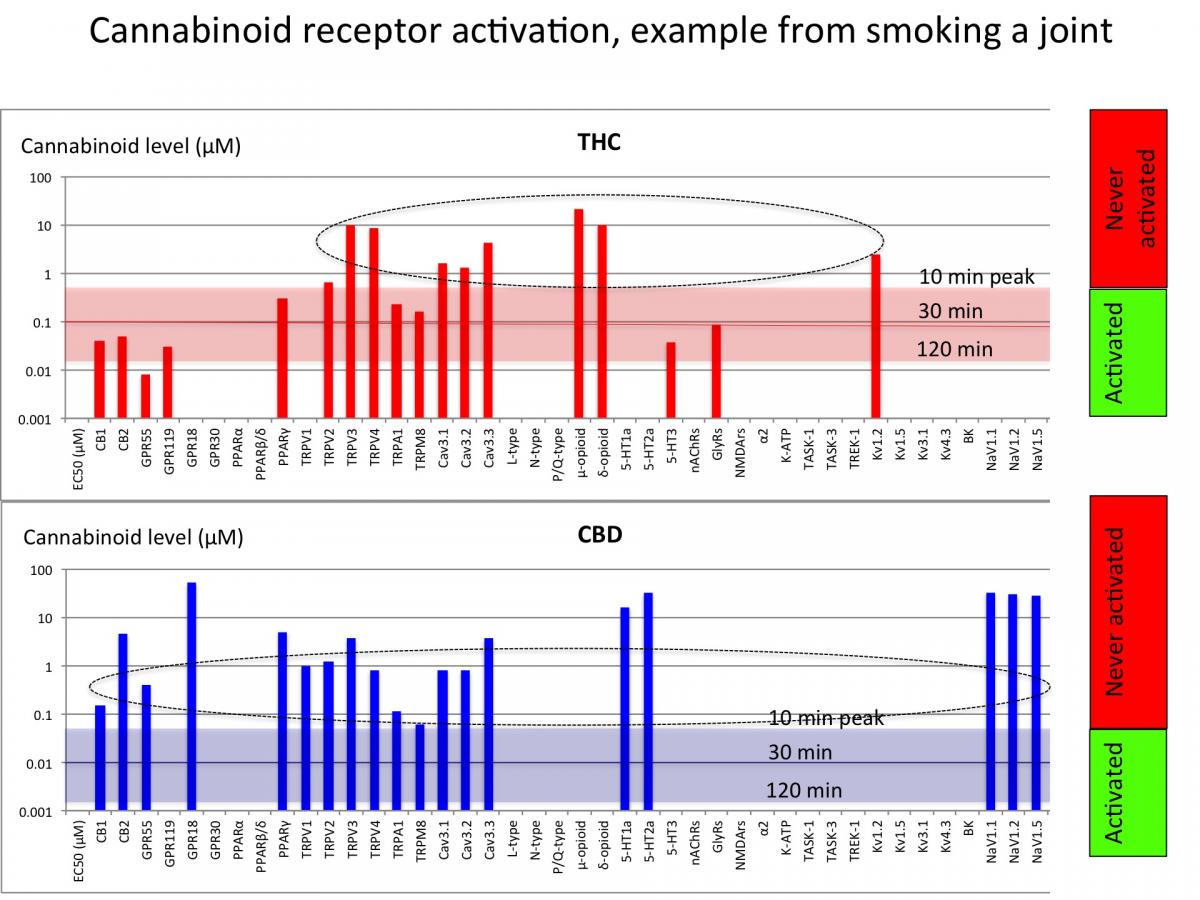
In the top panel, the red bars represent receptors that can be activated by THC. The vertical axis represents the physiological range of cannabinoid levels that can be found in the body. The transparent red box illustrates the range of THC levels that can be expected at the peak, ten minutes after starting to smoke (top of the box), after half an hour (red line) and after 2 hours (bottom of the box). When a red bar does not reach the red box (GPR55) this means that this receptor will be activated strongly and for a long time after smoking cannabis.
When a red bar ends in the red box (CB1) this means the receptor will be activated as long as the cannabinoid level is higher than the bar.
When a red bar ends above the red box (TRPV3) this means the receptor is never activated by smoking cannabis. In the case of THC this means that 8 out of 18 receptors are never activated. However, the bottom panel shows that 0 out of 19 receptors are activated by CBD after smoking cannabis[1]. This shows a very important point about cannabinoids: smoking cannabis may be effective to treat some ailments but it cannot be expected to have therapeutic potential for each of the diseases mentioned above. Therefore, to reach the full therapeutic potential of cannabinoids, stronger cannabinoid preparations or extracts are necessary. Also, smoking may not be the most effective way to deliver cannabinoids and other routes of cannabinoid application need to be explored (see below).
cannabinoid – Receptor Activation Matrix
When we make a similar receptor activation profile for all cannabinoid receptors, we end up with the cannabinoid-Receptor Activation Matrix (Figure below)[2].
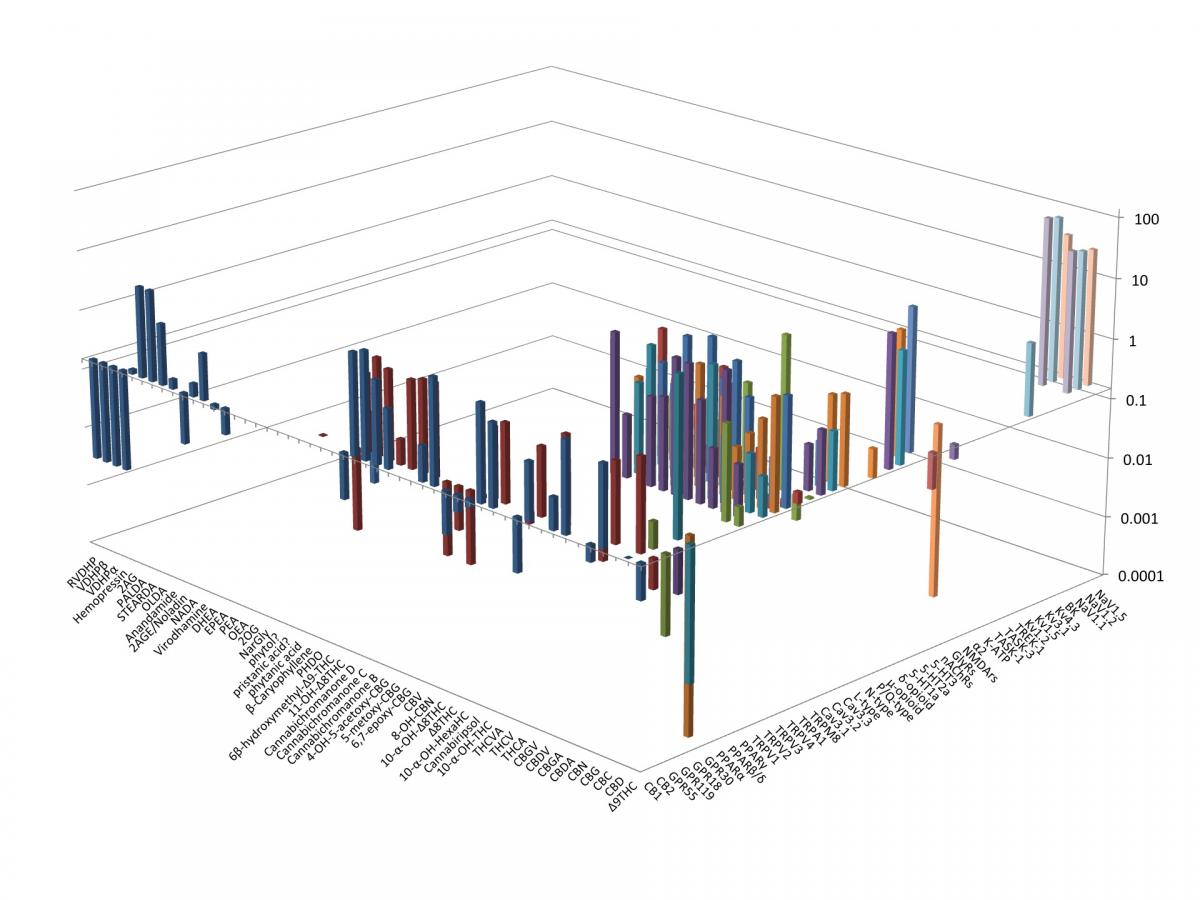
The X-axis, going from the front to the left contains all plant cannabinoids (THC, CBD etc.) and all endocannabinoids (NarGly, 2OG etc.) that are known to bind, activate, inhibit or otherwise modulate the function of any of the known cannabinoid receptors.
The Y-axis, going from the front to the right contains all cannabinoid receptors known to be bound, activated, inhibited or otherwise modulated by any of the known cannabinoids.
The vertical Z-axis, going from 0.0001 to 100 μM (micromolar) covers the physiological range of cannabinoid concentrations at which they operate (bind receptors).
The red line on the Y-axis indicates the peak THC level after smoking one joint (corresponding to the top of the red bar in figure 7). If we draw a virtual plane through the graph at the level of the red line any bar pointing up represents a receptor that is not activated by that particular cannabinoid at that concentration. Any bar pointing down represents a receptor that is activated.
What we see is that at this particular level (peak THC level after smoking one cannabis cigarette) most receptors are not activated by most cannabinoids. It should be realized though that most cannabis is very high in THC and very low in all other cannabinoids and realistic cannabinoid levels are easily 10 to 100 times lower than that of THC. If we were to draw a plane around the 0.01 or 0.001 we would see that almost no receptors are activated. This means that smoking a joint may activate a few receptors by THC but the vast majority of cannabinoid-receptor interactions require far higher cannabinoid levels and thus different methods of application.
The cannabinoid-Receptor Activation Matrix shows that different cannabinoid receptors are differentially activated by different cannabinoids at different levels. We also know that different receptors are relevant to different bodily functions. Thus, to combat cancer an entirely different cocktail of cannabinoid is required than for instance to treat epilepsy.
The data used in this graph is derived from many different studies using different methodologies making interpretation of this matrix difficult. In addition, many of the possible cannabinoid-receptor interactions are still blank. This could be because the interaction does not exist or because it has not been tested yet.
As a first step towards discovering the full therapeutic potential of cannabinoids, the cannabinoid-Receptor Activation Matrix should be remade using standardized methods. This matrix can then be used to formulate optimal cannabinoid cocktails for each eligible disease.
[1] Values for receptor activation are derived from literature. For a full justification of the used values please see: http://www.ghmedical.com/endocannabinoid-system/
THC values are adopted from: Huestis, M.A. (2007). Human cannabinoid Pharmacokinetics. Chem. Biodivers. 4, 1770–1804. CBD values after smoking cannabis have never been measured but are extrapolated from THC and the estimated CBD content in commercially available cannabis.
[2] The cannabinoid-Receptor Activation Matrix is derived from a meta-analysis of values reported in many different studies. Since not all studies used the same methodology and criteria one should be careful interpreting this graph. However, one conclusion that can be safely drawn from this graph is that most cannabinoid receptors are activated by different cannabinoid at different levels and thus that cannabinoid cocktails of different compositions can be used to achieve any particular effect.